Edison Prep’s Famous UGA Admissions Data and Strategy Page — Tracking UGA Stats Since 2012!
– Edison Prep Exclusive –
– Edison Prep Exclusive –

In 2012, we posted our original “All About UGA: Ruminations from the UGA Admissions Process” blog post, which attracted more than 40,000% as many views as our other blog posts. Ever since, we’ve published multiple annual updates just moments after UGA releases EA decisions, RD decisions, and other updates throughout the year!
UGA is a school of particular interest to many Edison Prep clients, so we continue to do deep dives into its admissions trends and maintain a decade-long repository of UGA admissions data. Below is information that is of interest to all families with students who may be applying to UGA in the next few years!
Note: This page is regularly updated throughout the year as new rounds of UGA admissions data get released!
Last Update: Mar. 12, 2026
Early Action applicants have more than tripled since 2012, increasing +217% while the Georgia and the US populations have grown just 10% and 8%, respectively. UGA has gone from 10,800 EA applicants for the Class of 2012 to 34,280 for the Class of 2025. UGA joining the Common Application in 2020 during the middle of COVID provided an initial 26% surge in applications that has been sustained and built upon. When UGA announced that the SAT and ACT would be mandatory for the Class of 2022 after the one-year COVID test optional policy, some college counselors imagined there would be fewer applications for Class of 2022 as a result, but applications continued to grow by 25% the following two years. This makes sense, since by and large, SAT/ACT tests were widely available in Georgia (and 40+ states) for the duration of COVID.

“Weren’t you surprised to see another 13% increase in Class of 2026 applicants despite UGA going back to SAT/ACT test-required when many colleges haven’t? After 11-21% compounded increases each year from 2022-2025 as well?”
We get this question daily!
![]() “Test Optional applicants shall not be disadvantaged”
“Test Optional applicants shall not be disadvantaged”
Few schools released data re: relative admit rates for those who submitted scores vs. those who didn’t. (We emailed and called over 200 schools.) For the dozen or two brave schools who did, the data was stunning:

![]() Case Study: Auburn
Case Study: Auburn
(Note: Auburn went back to test mandatory for Class of 2027)

As many Georgia families find the Zell Miller HOPE scholarship price tag for a top 20 public university enticing (compared to more expensive private colleges) in uncertain economic times, applications continue to grow. Keeping the number of EA admits at a reasonable level is a conscious choice that UGA makes to allow themselves to see the whole applicant pool before deciding on EA applicants who may be “on the bubble.” Very smart!
Given that UGA and Florida are both test mandatory while some of the high-ranking “public Ivies” are test optional and have just a small portion of students who submit scores that inflate their averages, it’s accurate to say that UGA and U of Florida have the highest test score averages of any public universities on the planet. (e.g. mid-50% of 31-34 ACT)

■ EA Admitted ■ EA Enrolled
UGA generally defers about half of all EA applicants to the Regular Decision round, and other than one blip, maturely denies about 18% of applicants so as not to give false hope. This is actually a welcome, merciful change in our opinion from a student mental health perspective, since the majority of deferred students that reach out to us for a post-mortem analysis once deferred share academic stats that stand no earthly chance of defer-then-admit, yet those students must undergo four months of false hope until the admissions process formally ends. We’d personally love to see Early Action denials around 35% , but 19% is a great start.
Note: The specific data for class of 2026 wasn’t released but felt very similar to prior years.
UGA Early Action Trend: Admit/Defer/Deny

Note: You may see slightly different stats quoted on various UGA pages because 1,800 EA applicants (7%) were incomplete and got rolled into the Regular Decision pool.
| Class of 2026 EA Applicants | Previous Year | |
|---|---|---|
| Class of 2026 Total Early Action Applicants | 34,280 | +12% |
| Geography | 40% in-state, 60% out of state | Per Georgia rule, approximately 80% of total *enrolled* students are targeted for in-state students, but out of state students enroll less often, so the admits are pretty balanced! |
| UGA mid-50% GPA Average | 3.91 | over 56% of applicants had over a 4.0 GPA |
| ACT mid-50% Average | 26-32 (Note: 2024 number, was not published in 2025) | basically identical |
| SAT mid-50% Average | 1240-1440 (Note: 2024 number, was not published in 2025) | basically identical |
| AP/IB/DE mid-50% Courses | 5-11 (Note: 2024 number, was not published in 2025) | identical |
| In-State Residents Only | Previous Year | In-State and Out-of-State Residents | Previous Year | |
|---|---|---|---|---|
| Class of 2026 Total Early Action Admits | 6,100 | 5,350 | 10,760 | 9,500 |
| UGA GPA | 4.19-4.45 | 4.18-4.43 | 4.19-4.44 | 4.17-4.40 |
| ACT Mid-50% Average | 31-35 | 31-34 | 31-35 | 31-34 |
| SAT Mid-50% Average | 1370-1500 | 1350-1510 | 1380-1500 | 1370-1500 |
| AP/IB/DE courses by graduation | 10-15 | 9-14 | 10-15 | 9-14 |
View the full statistics for Early Action and Regular Decision admitted students for Class of 2012 - Class of 2026


Just 2.667 students in Georgia got a single-day ACT score of 31 or higher for the Class of 2024, yet 75% of those accepted to UGA from the Class 2024 scored a 31 or higher, and over 10,700 students were admitted via Early Action this year. How is this possible, especially given that not every high-scoring applicant even applies to UGA?
Yes, some students submitted an SAT score, but a huge contributing factor is that UGA “superscores” both the ACT and SAT (combines the best section scores from different dates). It’s a real game-changer. Savvy parents, counselors, and students understand the power of superscoring far better than they did a few years ago, driving average SAT/ACT scores at the 95%+ of colleges that superscore upwards. This is why the average student in suburbia now takes the SAT/ACT 3 times, compared to 1 time in the 1990s! Also, please know that both parents and students tend to fib about their scores; the actual number of single-day perfect 36’s in Georgia last year was just 102 kids in a state with 159 counties!

Senior Associate Director of UGA Admissions David Graves posted a quote on the UGA Blog that we sincerely wish were included at the top of every UGA mailer: “When parents or students say that their schedule is already so busy with other activities that it is tough to handle challenging courses…instead of dropping rigorous courses, maybe an activity could be dropped.” We tell students daily that no one has ever been ever rejected for having too low of a “play practice score,” but millions of applications are rejected each year for low GPA, low rigor, and/or low SAT/ACT scores. Activities matter if and once your core academic metrics are in the right ballpark.
Fun Fact: 93% of all grades earned by Class of 2026 Admits were A’s. Keeping the total number of B’s to 5 or fewer the first 6 semesters is absolutely critical.

The vast, vast majority of students should apply Early Action. Historically, 10-20% of students are denied via Early Action, which is a far lower EA rejection percentage than some of UGA’s peer universities. The vast, vast majority of EA applicants who are not admitted are deferred, not denied. Since 2010, we’ve tutored 14,000+ students who applied to UGA who hailed from over 125 high schools and over 50 Georgia counties. When comparing notes with our brain trust of 20 independent college counselors, we realized that we all collectively only had only a dozen or two students rejected via EA in any given year. Applying early action is almost always a zero-risk endeavor, because any student who was close enough to gaining admission via EA who might benefit from having one extra semester of grades and/or a better SAT/ACT score would likely also be a strong enough applicant to at least get deferred. The only exception would be someone who had some severe GPA issues early on that needs one extra senior semester for “GPA rehab” or has a sky-high GPA but an extremely low SAT/ACT and needs time to take the test 1-2 more times.
Thousands of deferred students eventually are accepted in March during Regular Decision.
The only two levers deferred students can pull to increase their chances are:

![]() Class of 2022 Example
Class of 2022 Example
Case study:
After the Early Action round in November 2021, the math on remaining seats was as follows:
~4,640 spots left
——-
~17,000 EA deferred* + 17,320 RD applicants
= 4,640 admits left for 34,320 applicants = 14% admit rate for the combined deferred Early Action + Regular Decision pool
A fair number of RD kids were waiting on an extra semester of awesome grades, or extra two sets of test scores in Oct/Nov/Dec, and/or just couldn’t finish the essays in time. If correct, that would imply admission offers for about 14% of the combined remaining defer + RD pool.
NOTE: The exact % deferred during EA was not released for 2026 but in 2023-2025 was close to 50%, which was used in the above example.
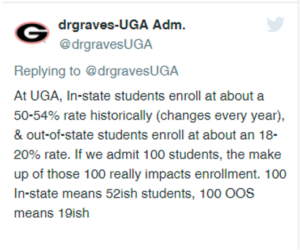
Different yield rates for in-state versus out-of-state students: Per David Graves’ March 2022 Blog Post: “The yield rate (% of admitted students that enroll) for in-state students is between 52-55%, and out-of-state student yield is between 19-21%.” This makes sense given that 90%+ of students who get into UGA have a 3.7+ GPA and a 26/1200+ ACT/SAT and thus get full tuition Zell Miller HOPE whereas out-of-state tuition is pricey!
It’s also why parents shouldn’t be rattled when reading how many in-state versus out-of-state kids were ***admitted*** since to achieve a 20% OOS student body they need to admit more than double that proportion! Even more so with the current economic conditions!

If you are a confused parent of a deferred/denied senior or a Type A pre-planning parent of an 8th-11th grader, it’s critical to educate yourself on the state of grade inflation so you can avoid critical GPA mishaps early in high school. 86% of students nationwide now graduate with an A average.


Keeping your total number of “B’s” for all six semesters on one hand is paramount. Data on the Class of 2021’s GPA was similar.

(Here’s the math: 8% of 30 “core” semester grades over six semesters means 2.4 B’s.)
Grade inflation, combined with AP/IB GPA weighting, has created dramatically higher GPAs each year at most metro Atlanta schools, warping parents’ perception of what a “normal” GPA is.
The average UGA EA ADMIT in 2012 had roughly a 3.91 GPA.
Over 56% of students who APPLIED in 2023 had a above a 4.0 GPA
![]() Case Study: A Popular Cobb County school’s grade inflation in 2019
Case Study: A Popular Cobb County school’s grade inflation in 2019
At this school in 2019, almost 30% of students have a weighted 4.0+ GPA. 3.64 is a bottom 50% GPA. A 4.38 is not even in the top 10%.
Simultaneously, only 8% of students in GA (Class of 2019) got a 30+ on the ACT. A 30 ACT or 1400 SAT is almost 400% as rare as a 4.0 at many schools. In our world where “A stands for Attended,” keeping B’s to a minimum is critical!

This GPA data is no longer published by the above Cobb County high school in question, but has certainly inflated much further in the intervening five years since they stopping sharing the data.


C’s were a thing in the 90’s. They are an endangered species in 2024. A “C” grade may mathematically count the same as two “B’s”, but our internal data (and those of our college counselor friends) shows that each “C” is exponentially more damaging than getting two “B’s”. And UGA’s own blog post “Freshman Denies — A Post Mortem” from 2018 confirms it: a single “C” increases the chance of denial to 85%. A “D” or “F” grade increases the chance of denial to 96%. When we see students with lots of C’s, it is rarely someone who can’t handle the material; it is usually someone who prioritized a during-the-school-year job at Chic Fil-A or 3-4 sports. The biggest risk a student will ever take is a huge 10+ hour a week job during the year or three sports junior year (unless being recruited). When the average UGA admit only had 3 B’s — ever — that is a very fair statement!


In 2019, Edison Prep was invited on a national education podcast to discuss the importance of grade inflation. You can listen to that podcast here: The Reality of Grade Inflation
Remember that while SAT/ACT scores are important, a high GPA combined with a rigorous curriculum will always be the single most important factor for admission. Keep that GPA sky-high! Additionally, if UGA is on your student’s list, we’d highly encourage you to read the UGA Admissions Blog regularly. UGA has one of the most responsive and high-touch blogs of any college admissions blog in America; David Graves does an amazing job.
Edison Prep is a boutique SAT/ACT tutoring company whose small team has over 160,000 hours of experience: the most experienced tutors in Georgia. Their founders, who are the two most experienced tutors in Georgia, with over 70,000 hours of experience, personally teach all of the group classes themselves. They also authored their own SAT/ACT books that are revised each year. Finally, we are unique among Atlanta tutors in that they we take the real tests each year, earning top 0.5% scores, including the only back-to-back-to-back perfect 36’s in history. Our team sees students doing pure private tutoring, pure class tutoring, or (many times) a blend of the two! Read more about our founders >
We get results.
Our full SAT/ACT score increase data and hundreds of happy testimonials are transparently posted on our Results Page. Since 2010, Edison Prep has helped over 23,000 students get into better colleges and/or cut the cost of college via merit aid, including over 6,500 students who’ve been admitted to UGA.
Interested in learning more about our SAT/ACT preparation?
We offer both in-person prep in Atlanta and virtual prep worldwide! We’ve tutored students from 28 states and eight countries! Learn more about our classes >
Do you want free strategy advice on college admissions, scholarships, and test prep?
We conduct free parent info sessions several times each year with candid straight talk about the college process. RSVP to attend the next session!
Questions?
Feel free to email us with questions at [email protected] or call us at 404-333-8573!
Miscellaneous FAQs we get each year culled from UGA’s blog posts, conversations with their personnel, etc.
Fulton pre-adds the AP points to grades and thus it seems I can’t get above a 4.0. Does this disadvantage students from Fulton County since a 4.0 is literally the maximum possible GPA?
Don’t worry! UGA is used to this quirky, unfortunate issue with Fulton and has worked around it for many years to do right by students. If that were actually the case, we’d see almost no students getting in from Fulton, which obviously isn’t the case! Crucial 2022 Update: New changes that affect Fulton County students are here!
Is there a quota that UGA admits from each high school?
There is no quota by high school. One smart thing that UGA does do when possible is have the same counselor read files from a given high school, since there are such wildly different grading standards, AP classes granted, etc. between high schools. That way, there’s better context/understanding of a given school’s grading style.
Is it true that extra "UGA GPA" points are awarded for AP and IB classes, but not for dual enrollment or for honors?
Yes.
I self-reported my ACT/SAT scores on the Common App. Do I still have to send my scores directly from the testing agency?
Yes. We have 5-10 students a year who have an “oops” and end up in the Regular Decision pool instead of Early Action because they don’t follow these instructions.
Should my deferred student submit a Letter of Continued Interest (LOCI)?
No, UGA does not take demonstrated interest into account; they assume that all applicants are interested due to the fact that they applied.
My student got in! Is it true that they can rescind your offer if senior year grades drop noticeably?
Yes, an “F” would trigger a review, as would 2+ C/D/F grades. We’ve unfortunately had a few students over the years have offers rescinded. Not every year, but heartbreaking when it happens.
My student‘s teammate/student’s boyfriend/neighbor’s kid/kid from church got in and my kid was deferred, but the other kid had a lower GPA, lower SAT/ACT, and similar APs, and from the same high school! How is that possible?
There are many reasons, one of which is that the UGA GPA only counts core classes (not PE, band, etc), which means that the high school GPA may have actually been higher or the same. Additionally, UGA uses just the English and Math portions of the ACT, whereas most parents mention their student’s composite score. Finally, a good number of EA applications get deep reads during the process (not just the stats) and the qualitative parts of the application may have made the difference.
My student was denied. Did I mess up by applying EA and not waiting until RD?
Don’t beat yourself up. Only 10-12% of students are rejected via EA, meaning that a student denied in EA had 18,000+ applicants ranked ahead of them. Barring something very odd, a denied student would not have enough new information crop up between October 15th and January 1st to catapult them over the 10,000+ deferred students plus 20,000+ new Regular Decision applicants come March. Knowing a denial earlier rather than later allows a student to make alternate plans: apply elsewhere and/or start planning their eventual UGA transfer strategy!
Should my denied student appeal? Have you ever seen an appeal work?
We haven’t seen a single successful appeal yet among our 10,000+ students who’ve applied since 2007.
How does the in-state versus out-of-state dynamic work?
Part of why you should be cautious about making assumptions about out-of-state vs. in-state comments or data that’s posted on the UGA website is that in-state people are more likely to enroll. 95%+ of UGA Admits qualify for Zell/HOPE, while out-of-state admits are less likely to accept an offer of admission because out-of-state tuition is $31K+! Thus, changes in the overall number of admits in various rounds, without knowing the number of in-state vs. out-of-state, cloud things a little bit. David Graves makes this point well:
Please feel free to share!


© Copyright 2010-2026 Edison Prep. All rights reserved. *ACT is a registered trademark of ACT, Inc., SAT and AP are registered trademarks of the College Board, PSAT/NMSQT is a registered trademark of the College Board and National Merit Scholarship Corporation; and none were involved in the production of, or endorses, Edison Prep.

 Looking for a Speaker or Podcast Guest?
 Scroll to top